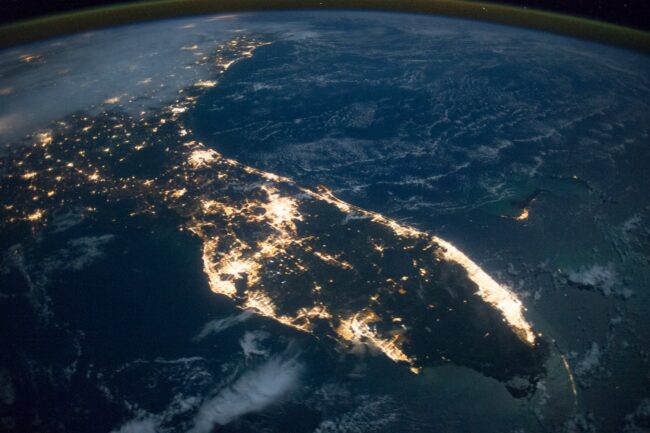
Florida at night from the International Space Station, Oct. 13, 2014, with the Miami-Fort Lauderdale area brightest. Photo: NASA / Expedition 41 crew, Public Domain.
Quick Answer: U.S. Census Bureau Vintage 2025 estimates show the four-county South Florida region (Palm Beach, Broward, Miami-Dade and Monroe) lost about 10,500 residents between July 1, 2024 and July 1, 2025, falling to 6,471,478. Net international migration of 93,809 could no longer offset net domestic outflows of 115,655. Palm Beach was the only one of the four counties to grow, and only barely.
For most of the early 2020s, South Florida’s population story had two competing parts. Residents kept leaving for other parts of Florida and the country, and a large wave of newcomers from abroad more than made up the difference. In the year ending July 1, 2025, that balance tipped. The Census Bureau’s Vintage 2025 county estimates, released March 26, 2026, show the region’s combined population declined for the first time since 2021, even as Florida as a whole added 196,680 people.
Below, the Census components for each county from West Palm Beach to Key West are set against University of Florida Bureau of Economic and Business Research (BEBR) estimates and the latest labor force data.
How much did South Florida’s population change in 2025?
The Census Bureau estimates the four counties held 6,471,478 residents on July 1, 2025, down from 6,481,996 a year earlier. The net loss was 10,518 people, or about 0.16%. Miami-Dade accounted for nearly all of it.
| County | July 1, 2025 population | Change from 2024 | Percent change |
|---|---|---|---|
| Miami-Dade | 2,802,029 | -10,115 | -0.36% |
| Broward | 2,013,317 | -372 | -0.02% |
| Palm Beach | 1,575,726 | +1,578 | +0.10% |
| Monroe | 80,406 | -1,609 | -1.96% |
| Four-county total | 6,471,478 | -10,518 | -0.16% |
Source: U.S. Census Bureau, Vintage 2025 County Population Totals and Components of Change (July 1, 2024 to July 1, 2025).
Nationally, the Census Bureau put Miami-Dade’s loss of 10,115 residents as the third-largest numeric decline of any U.S. county in 2025. Only Los Angeles County, California (-53,934) and Pinellas County, Florida (-11,834) lost more. The bureau also flagged Monroe County’s 2.0% decline among notable Florida results. At the same time, inland Florida metros such as Ocala (3.4%), Lakeland-Winter Haven (2.7%) and Punta Gorda (2.7%) ranked among the nation’s fastest-growing.
The broader pattern was national. U.S. population growth slowed to 0.5% in 2025, about half the prior year’s 1.0%. The 50 counties with at least 1 million residents had a combined net domestic migration loss of 637,634. Census Bureau demographer George M. Hayward said large counties that usually draw many international migrants and lose residents to other parts of the country “saw their population growth diminish or even turn into loss.” Miami-Dade and Broward fit that description.
What are the components of South Florida’s population change?
The Census Bureau splits change into natural increase (births minus deaths), net international migration and net domestic migration (moves between U.S. counties), plus a small statistical residual.
| County (2025) | Natural increase | Net international migration | Net domestic migration |
|---|---|---|---|
| Miami-Dade | +8,749 | +54,204 | -72,254 |
| Broward | +4,422 | +24,944 | -29,517 |
| Palm Beach | -593 | +14,302 | -11,953 |
| Monroe | -25 | +359 | -1,931 |
| Region | +12,553 | +93,809 | -115,655 |
Source: U.S. Census Bureau, Vintage 2025 County Population Totals and Components of Change.
Is natural increase still adding people?
Barely. Miami-Dade recorded 30,011 births and 21,262 deaths, and Broward recorded 20,395 births and 15,973 deaths, so the two urban counties still add residents naturally. Palm Beach recorded 15,810 deaths against 15,217 births. Monroe also had slightly more deaths than births. The regional natural increase of 12,553 is small next to the migration flows. Statewide, Florida’s natural change was close to zero at -1,333.
How large is international migration in South Florida?
Still the region’s main source of new residents, but much smaller than before. The four counties added 93,809 net international migrants in 2025. That was down from 137,794 in 2024 and a peak of 176,265 in 2023, a drop of about 47% in two years. Miami-Dade alone took in 54,204, about 30% of Florida’s statewide total of 178,674. The Census Bureau listed Miami-Dade with Harris County, Texas, and Los Angeles County among the three U.S. counties with the largest 2025 net international migration.
The bureau said every state and 90% of U.S. counties saw lower international migration in 2025. It also changed its methods for this vintage. These include a new way of placing humanitarian migrants in the counties where they live, using Department of Justice immigration court data, and an adjustment for higher emigration that lowers the 2025 estimates.
How many residents are leaving for other parts of the U.S.?
More every year since 2022. Net domestic migration out of the four counties reached 115,655 in 2025, up from 103,796 in 2024 and 67,809 in 2023. Miami-Dade’s net outflow of 72,254 was the largest of any Florida county, a point a July 2026 University of Florida analysis also highlighted. Palm Beach’s shift is the sharpest: it gained 9,286 domestic movers in 2022 and lost 11,953 in 2025.
How has the region changed since the 2020 Census?
The single-year decline comes after several years of growth. Measured from the April 2020 estimates base, the four counties added 250,278 residents through July 2025, about 4.0%. Florida grew 8.9% over the same period, so South Florida grew at less than half the state’s pace. The region’s share of Florida’s population is now about 27.6%.
| County (April 2020 to July 2025) | Total change | Cumulative net international | Cumulative net domestic |
|---|---|---|---|
| Miami-Dade | +100,267 (3.7%) | +348,819 | -278,091 |
| Broward | +68,941 (3.5%) | +149,028 | -96,399 |
| Palm Beach | +83,535 (5.6%) | +92,513 | +776 |
| Monroe | -2,465 (-3.0%) | +4,060 | -6,201 |
Source: U.S. Census Bureau, Vintage 2025 County Population Totals and Components of Change; cumulative figures summed from annual components.
Over five years, international arrivals of nearly 595,000 more than covered domestic departures of about 380,000. Palm Beach is the only county that broke roughly even on domestic moves, because its early-decade gains offset recent losses. Monroe is the only county with fewer residents than in 2020.
Where are Miami-Dade’s movers going?
An infographic from Florida International University’s Metropolitan Center, drawing on IRS migration data for 2022 to 2023, identifies Broward as the top destination for people moving out of Miami-Dade. The same FIU analysis reports that movers produced a net gain in adjusted gross income for Miami-Dade despite the population loss. In other words, the people moving in earned more on average than the people leaving. The University of Florida’s July 2026 analysis, also citing IRS data, found that many movers to fast-growing counties such as Polk and Pasco came from elsewhere in Florida. Anne Ray, manager of the Florida Housing Data Clearinghouse at UF’s Shimberg Center, said many movers “appear to be looking beyond the state’s largest urban counties to communities where homes are more affordable.”
What do University of Florida BEBR estimates and projections show?
BEBR produces annual population estimates for Florida and each of its counties. Its figures use a different method and an April 1 reference date, so they do not match the Census numbers. BEBR’s April 1, 2025 estimates put Miami-Dade at 2,814,927, Broward at 1,993,535, Palm Beach at 1,556,161 and Monroe at 84,707. That is 6,449,330 for the region, a gain of about 228,000 since the 2020 Census. Unlike the Census series, BEBR shows Monroe slightly above its 2020 count.
| County | BEBR estimate, April 1, 2025 | Medium projection, 2030 | Medium projection, 2050 |
|---|---|---|---|
| Miami-Dade | 2,814,927 | 2,916,375 | 3,140,714 |
| Broward | 1,993,535 | 2,059,178 | 2,184,724 |
| Palm Beach | 1,556,161 | 1,627,593 | 1,766,844 |
| Monroe | 84,707 | 87,231 | 91,479 |
| Region | 6,449,330 | 6,690,377 | 7,183,761 |
Source: University of Florida BEBR, Florida Population Studies Bulletins 202 and 203 (projections published February 2026).
BEBR’s medium projections, published February 2026, assume continued growth: about 241,000 more residents in the region by 2030 and roughly 734,000 more by 2050. The range is wide. Miami-Dade’s 2030 projection runs from a low of 2,766,800 to a high of 3,066,000. Broward’s runs from 1,953,500 to 2,164,800, and Palm Beach’s from 1,544,100 to 1,711,100. BEBR bases its low and high series on past forecast errors and says they are meant to contain about three-quarters of future outcomes. The recent Census trend, with two large counties shrinking, sits closer to the low end than the medium path for now.
What does population change mean for South Florida’s labor force?
The workforce numbers point the same way. FloridaCommerce data for July 2026, not seasonally adjusted, put the four-county labor force at 3,317,079. That is about 11,400 fewer than in July 2025. Employment fell by about 17,100 over the same period, to 3,194,188.
| County | Labor force, July 2026 | Labor force, July 2025 | Unemployment rate, July 2026 |
|---|---|---|---|
| Miami-Dade | 1,431,927 | 1,430,050 | 2.5% |
| Broward | 1,067,539 | 1,076,030 | 4.6% |
| Palm Beach | 768,882 | 773,015 | 4.8% |
| Monroe | 48,731 | 49,400 | 3.3% |
Source: FloridaCommerce, Florida Unemployment Release for July 2026, as published by CareerSource Broward (not seasonally adjusted).
Miami-Dade’s labor force held roughly flat, and its unemployment rate fell from 2.9% to 2.5%. Broward’s rose from 3.9% to 4.6% and Palm Beach’s from 4.1% to 4.8%. Statewide, Florida’s seasonally adjusted rate was 4.6% in July 2026. A labor pool that stops growing makes hiring harder in industries that relied on new arrivals, including construction, hospitality, health care support and logistics.
How does population change affect housing and consumer demand?
Household formation kept going after headcount growth stalled. BEBR estimates the four counties held 2,466,635 households on April 1, 2025, up about 98,000 from the 2020 Census count of 2,368,387. Household size varies widely. Miami-Dade averages 2.72 persons per household, Broward 2.55, Palm Beach 2.41 and Monroe 2.24, against a statewide average of 2.46. Smaller households mean more housing units for the same number of people, so household counts can keep rising for a while even when the population flattens.
For retailers, restaurants and service businesses, the issue is who is arriving more than how many. Net international migrants and residents moving out of the region are different groups with different incomes and spending habits. The IRS-based finding that Miami-Dade gained adjusted gross income while losing filers suggests spending power is not falling as fast as headcount. Palm Beach, still growing slightly and with a high death-to-birth ratio, continues to depend on movers to replace its aging population. Monroe’s shrinking resident base adds to pressure on the year-round workforce that serves its visitors.
Which South Florida county is gaining and which is losing?
On the 2025 Census numbers, Palm Beach was the only gainer, at +1,578. Miami-Dade posted the largest numeric loss and Monroe the largest percentage loss. Broward was essentially flat. Over the full 2020 to 2025 period, Palm Beach grew fastest at 5.6%, and Monroe is the only county below its 2020 base.
Brian’s Take
As a former investment manager and analyst, I look at what keeps a market growing, and these numbers show that one source of growth has weakened. For five years South Florida’s growth rested on international arrivals. That flow fell from about 176,000 in 2023 to under 94,000 in 2025, while the number of people moving out to other parts of the country rose every year. When that happens, a region with roughly 6.5 million people can lose ground even while the state around it keeps adding nearly 200,000 residents a year.
I would not call that a collapse. The region still has more births than deaths in its two biggest counties, household counts are still rising, and Miami-Dade’s income data suggest the people arriving tend to earn more than those leaving. But the business plans written in 2022 and 2023 assumed a steady stream of new workers and customers. BEBR’s medium projections still show growth, and its own low-end range shows that a flat decade is possible.
The practical takeaway is to plan around a tighter labor pool and slower headcount growth across the whole region, not just one county. Companies that need entry-level workers, builders deciding how many units to start, and landlords counting on new renters should all test their assumptions against the 2025 components, not the boom years.
Frequently Asked Questions
Did South Florida’s population shrink in 2025?
Yes, slightly. Census Vintage 2025 estimates show the four counties fell by 10,518 residents to 6,471,478 between July 1, 2024 and July 1, 2025.
Why did Miami-Dade County lose population?
Net domestic migration of -72,254 exceeded net international migration of +54,204 and natural increase of +8,749. The result was a net decline of 10,115, the third largest among U.S. counties.
Is international migration to South Florida falling?
Yes. Net international migration to the four counties fell from 176,265 in 2023 to 93,809 in 2025. The Census Bureau also changed its methods this vintage, including a higher emigration adjustment.
Which South Florida county grew in 2025?
Only Palm Beach, which added 1,578 residents (0.10%). International migration of 14,302 offset a domestic outflow of 11,953 and slightly more deaths than births.
Why do BEBR and Census population figures differ?
They use different methods and reference dates: April 1 for BEBR and July 1 for the Census Bureau. BEBR’s county projections start from its own April 1, 2025 estimates.
Sources and Further Reading
- Vintage 2025 County Population Totals and Components of Change, datasets for counties, 2020-2025 — U.S. Census Bureau
- Vintage 2025 County and Metro Area Population Estimates, press release, March 26, 2026 — U.S. Census Bureau
- International Migration Remained Flat in the 10% of Counties That Did Not Experience a Decline — U.S. Census Bureau
- Florida Estimates of Population 2025 — University of Florida Bureau of Economic and Business Research
- Households and Average Household Size in Florida: April 1, 2025, Florida Population Studies Bulletin 202 — University of Florida BEBR
- Projections of Florida Population by County, 2030-2050, with Estimates for 2025, Bulletin 203 — University of Florida BEBR
- Florida County Population Projections, April 1 — Florida Office of Economic and Demographic Research
- Florida Migration analysis, July 2026 — University of Florida News, Shimberg Center for Housing Studies
- 2026 Florida Population Change infographic — Florida International University Metropolitan Center
- Florida Unemployment Release for July 2026 — FloridaCommerce, published by CareerSource Broward
About the Author