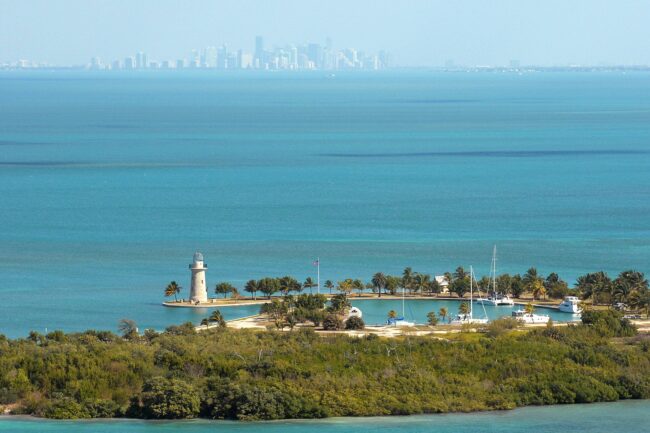
The Miami skyline seen from Boca Chita Key, Biscayne National Park. Source: Judd Patterson, National Park Service, via Wikimedia Commons. License: Public domain.
Quick Answer: The Bureau of Labor Statistics said on Nov. 10, 2026, that consumer prices in the Miami-Fort Lauderdale-West Palm Beach area rose 0.6% from August to October 2026. BLS did not publish a 12-month rate for October because it collected no October 2025 data during the 2025 federal funding lapse. The latest official annual figure is 3.7% for August 2026, compared with 3.4% nationally and 3.1% in the South region. Gasoline remains the main driver.
The latest Miami-area Consumer Price Index report is missing its headline number. On Nov. 10, 2026, the Bureau of Labor Statistics (BLS) released October 2026 data for the Miami-Fort Lauderdale-West Palm Beach metro, with two-month changes and index levels but no year-over-year inflation rate. BLS collected no price survey data in October 2025 because of a lapse in federal appropriations, leaving most series without a comparison base.
The data still show local prices rising faster than the national average, gasoline up nearly 40% from a year earlier, and metro core inflation well above the South region’s.
What did the November 2026 BLS release show for South Florida?
The Miami-area index is published every other month, in even months. The Nov. 10 release covers October 2026, and its main comparison is the two-month period from August to October. Over those two months, the all-items CPI for All Urban Consumers (CPI-U) rose 0.6%, to an index level of 372.471 (1982-84=100). The index excluding food and energy, known as core, rose 0.5%. These figures are not seasonally adjusted.
The metro index covers Broward, Miami-Dade and Palm Beach counties. Monroe County and the Florida Keys are not part of the sample. BLS also cautions that local indexes use smaller samples than national or regional ones, so they are more volatile.
| Category (Miami-Fort Lauderdale-West Palm Beach) | Change, Aug. to Oct. 2026 | October 2026 index |
|---|---|---|
| All items | +0.6% | 372.471 |
| All items less food and energy (core) | +0.5% | 388.463 |
| Food | +0.5% | 350.412 |
| Food at home | 0.0% | 326.468 |
| Food away from home | +1.6% | 394.753 |
| Energy | +2.7% | 278.857 |
| Gasoline (all types) | +4.9% | 366.878 |
| Shelter | +0.9% | 498.246 |
| Owners’ equivalent rent | +1.1% | 506.517 |
| Rent of primary residence | 0.0% | 489.331 |
| Medical care | +1.8% | 691.740 |
| Household furnishings and operations | -4.1% | 211.349 |
| Used cars and trucks | -1.7% | 373.735 |
Why is there no 12-month inflation rate for October 2026?
BLS could not publish October 2025 index values for most CPI series, so it cannot calculate October 2026 12-month changes for them. The gap applies to the national, regional and metro releases. In the Miami table, the exceptions include gasoline, new vehicles (up 0.7% over the year) and used cars and trucks (down 3.0%).
BLS has a factsheet on approximating missing data points. It suggests taking the geometric mean of the index values just before and just after the missing period, and it says any percent change built this way is an unofficial estimate. For the bimonthly Miami series, the surrounding values are August 2025 and December 2025. The December 2025 all-items index was 359.125. The August 2025 level, backed out of the published 3.7% annual change for August 2026, comes to roughly 356.9. Applying the BLS method to these figures gives an unofficial October 2026 annual rate of about 4.0%. That is our calculation, not a BLS figure.
The published indexes also support a cleaner measure. From December 2025 to October 2026, a 10-month span, the all-items index rose 3.7%. Core rose 3.0%, shelter 2.1%, food 0.8% and energy 20.6%.
How fast are gasoline and energy prices rising in South Florida?
Energy is the main reason Miami-area inflation is higher than it was in 2025. Gasoline is one of the few series with an official October 2026 12-month change. It rose 38.2% from October 2025 in the metro area, and unleaded regular rose 39.4%. Nationally, gasoline rose 37.4% over the same 12 months. In the South region it rose 39.0%.
The rise came in steps over the year. In the February 2026 Miami report, gasoline was 5.6% lower than a year earlier and the energy index was down 1.7%. In the April report, BLS said gasoline had jumped 40.2% in the two months from February to April. That lifted the 12-month energy change to 17.4%. Energy was still up 14.1% from a year earlier in June and 14.8% in August. In the latest period, gasoline rose 4.9% from August to October, though it slipped 1.1% from September to October.
Nationally, BLS said energy was up 20.4% over the 12 months ending in September 2026, largely because gasoline rose 34.2%.
Is core inflation in the Miami metro higher than the national rate?
Yes. In August 2026, the latest month with official 12-month figures, Miami-area core inflation was 3.3%. The comparable figures were 2.4% for the U.S. city average and 2.1% for the South region. Core inflation in the metro also rose during 2026, from 2.4% in February to 3.1% in April, 2.8% in June and 3.3% in August.
For perspective, the Miami all-items rate was 7.8% in August 2023, with core at 8.6%. Both had fallen to about 2.5% by August 2025 before energy pushed the headline rate back up.
| 12-month change, all items (core) | Miami-Fort Lauderdale-West Palm Beach | U.S. city average | South region |
|---|---|---|---|
| February 2026 | 2.1% (2.4%) | 2.4% (2.5%) | 1.8% (1.9%) |
| April 2026 | 3.8% (3.1%) | 3.8% (2.8%) | 3.6% (2.4%) |
| June 2026 | 3.4% (2.8%) | 3.5% (2.6%) | 3.2% (2.2%) |
| August 2026 | 3.7% (3.3%) | 3.4% (2.4%) | 3.1% (2.1%) |
| September 2026 | Not published (odd month) | 3.7% (2.6%) | 3.4% (2.1%) |
| October 2026 | Not published (no Oct. 2025 data) | Not published | Not published |
Monthly figures for October show the national and regional pace slowing. Seasonally adjusted, the U.S. all-items index rose 0.4% from September to October, down from 0.6% the month before, and core rose 0.3%. The South region index, which is not seasonally adjusted, was essentially flat in October, with core up 0.1% and gasoline down 2.4%.
What is happening to rents and shelter costs?
Shelter makes up the largest share of household spending in the CPI. In the Miami area, shelter inflation slowed through most of 2026. Annual shelter inflation was 3.1% in February and 3.8% in April, then eased to 3.3% in June and 3.0% in August. Rent of primary residence showed a similar pattern. It was up 3.5% from a year earlier in April and 2.4% in August, the slowest of the four 2026 readings.
In the October release, rent of primary residence was unchanged from August to October and fell 0.3% in October alone. Owners’ equivalent rent, which estimates what homeowners would pay to rent their own homes, rose 1.1% over the two months, lifting total shelter 0.9%.
| Miami-area 12-month change | Shelter | Rent of primary residence | Energy |
|---|---|---|---|
| February 2026 | 3.1% | 3.2% | -1.7% |
| April 2026 | 3.8% | 3.5% | 17.4% |
| June 2026 | 3.3% | 2.7% | 14.1% |
| August 2026 | 3.0% | 2.4% | 14.8% |
Nationally, shelter was up 3.2% over the 12 months ending in September 2026, and rent of primary residence was up 2.8%. South Florida’s measured rent growth was slightly below the U.S. pace by late summer. Because the CPI rent measure includes existing leases, it moves more slowly than asking rents.
How are food and medical prices moving?
Food has not been a major source of local inflation. In August 2026, Miami-area food prices were up 1.0% from a year earlier. Grocery prices were up 1.5%, and restaurant and other food-away-from-home prices were down 0.4%. Nationally, food away from home was up 3.4% in August.
The October release showed restaurant prices rising again. Food away from home rose 1.6% from August to October, while grocery prices were flat. Within groceries, cereals and bakery products rose 3.4% and fruits and vegetables fell 4.2%. Meats, poultry, fish and eggs fell 1.1%.
Medical care has risen faster: up 5.3% over the year in February 2026, 3.7% in August, and another 1.8% from August to October.
What does this mean for South Florida employers and wages?
Are paychecks keeping up with local prices?
Barely. The BLS Employment Cost Index shows private-industry wages and salaries in the Miami-Port St. Lucie-Fort Lauderdale combined statistical area rose 3.4% in the 12 months ending in September 2026, and total compensation rose 3.5%. Nationally, the figures were 3.1% and 3.4%. Local wage growth sits just below the 3.7% August CPI. The measures cover slightly different areas and months, but together they point to little or no real pay gain.
County wage data give a longer view. The BLS Quarterly Census of Employment and Wages for the first quarter of 2026 showed average weekly wages up 6.1% from a year earlier in Palm Beach County, to $1,784. Miami-Dade was up 4.5%, to $1,797, and Broward was up 4.0%, to $1,543. The U.S. average was $1,654, up 3.9%. The same report showed employment slightly lower than a year earlier in all three counties: down 0.3% in Miami-Dade, 0.9% in Broward and 0.1% in Palm Beach. National employment was up 0.1%. Monroe County’s average weekly wage was $1,224. Over-the-year changes were not published for Monroe.
How should businesses think about pricing?
Fuel-intensive businesses, such as delivery, field services and construction, face gasoline prices almost 40% above a year ago. Some goods costs are falling: household furnishings and operations fell 4.1% over the two months, used vehicles 1.7% and apparel 1.6%. The 1.6% rise in food-away-from-home prices shows restaurants raising menu prices again after declines in the spring and summer.
Contracts tied to CPI need attention. Many leases, service agreements and wage policies reference a 12-month CPI change, which does not exist for October 2026 for most series. Businesses whose escalators reset on October data should check the fallback language with their accountants or counsel. Possible substitutes include the latest published month, another index, or the BLS approximation method, which BLS calls unofficial.
What do slowing rents mean for landlords and tenants?
With CPI rent growth down from 3.5% in April to 2.4% in August and flat over the latest two months, residential landlords may have less room to raise rents at renewal. For employers, slower housing cost growth could ease some cost-of-living pressure on wages.
When is the next Miami-area CPI release?
BLS has scheduled the December 2026 Miami-area CPI for Jan. 13, 2027. December 2025 data were collected, so that release should bring back an official 12-month rate for the metro. The national November 2026 CPI is due Dec. 10, 2026, at 8:30 a.m. Eastern time.
| Key facts snapshot | Figure |
|---|---|
| Latest release | Nov. 10, 2026 (October 2026 data) |
| All items, Aug. to Oct. 2026 | +0.6% |
| Latest official 12-month rate (Aug. 2026) | 3.7% all items; 3.3% core |
| All items, Dec. 2025 to Oct. 2026 | +3.7% (calculated from BLS indexes) |
| Gasoline, Oct. 2025 to Oct. 2026 | +38.2% (U.S. +37.4%; South +39.0%) |
| Private wages, 12 months to Sept. 2026 (Miami CSA) | +3.4% |
| Counties covered | Broward, Miami-Dade, Palm Beach |
| Next Miami-area release | Jan. 13, 2027 (December 2026 data) |
Frequently Asked Questions
What is the current inflation rate in Miami-Fort Lauderdale-West Palm Beach?
The latest official 12-month rate is 3.7%, for August 2026. No October 2026 annual rate was published. Prices rose 0.6% from August to October.
Is South Florida inflation higher than the national rate?
Yes, as of August 2026: 3.7% in the metro versus 3.4% nationally and 3.1% in the South. Metro core was 3.3%, versus 2.4% nationally.
Are rents still rising quickly in South Florida?
No. CPI rent was up 2.4% over the year in August 2026, down from 3.5% in April, and was flat from August to October.
Does the Miami CPI include the Florida Keys?
No. It covers Broward, Miami-Dade and Palm Beach counties only.
When will an official 12-month rate return?
Likely with the December 2026 Miami-area CPI, scheduled for Jan. 13, 2027, because December 2025 data exist.
Sources and Further Reading
- Consumer Price Index, Miami-Fort Lauderdale-West Palm Beach, October 2026 (released Nov. 10, 2026), U.S. Bureau of Labor Statistics
- Consumer Price Index, Miami-Fort Lauderdale-West Palm Beach, February, April, June and August 2026 releases, U.S. Bureau of Labor Statistics
- Consumer Price Index, South Region, October 2026 and September 2026, U.S. Bureau of Labor Statistics
- Consumer Price Index news releases for February, April, June, August, September and October 2026, U.S. Bureau of Labor Statistics
- Notice on 12-month percent changes for October 2026, U.S. Bureau of Labor Statistics
- Approximating Missing Data Points factsheet, U.S. Bureau of Labor Statistics
- Employment Cost Index, Miami-Port St. Lucie-Fort Lauderdale, September 2026, U.S. Bureau of Labor Statistics
- County Employment and Wages in Florida, First Quarter 2026, U.S. Bureau of Labor Statistics
About the Author